


Architecture: A/B test for Onboarding Flow Optimization
- saurabhkamal14
- Feb 5
- 3 min read
A seamless onboarding experience is a vital element in ensuring users stay engaged and eventually become loyal customers. For a neo bank, an e-commerce, or edtech company aiming to expand its user base, optimizing the onboarding process was a strategic priority. The onboarding flow is the first significant interaction users have with the application, and improving it could lead to higher user engagement, better retention rates, and ultimately, increased customer lifetime value (CLV).
Our goal was to assess the impact of a newly designed onboarding flow compared to the existing one through a carefully structured A/B test. The results would provide actionable insights to refine user acquisition and experience strategies for the bank.
Objective:
The project aimed to:
Evaluate whether the optimized onboarding flow improved user engagement and retention metrics.
Provide robust, statistically significant insights to inform decision-making.
The Experiment:
We divided users into two groups:
Control Group (A): Users experiencing the existing onboarding flow.
Test Group (B): Users introduced to the new, optimized onboarding flow.
The impact was measured across three critical metrics:
Onboarding Completion Rate: Percentage of users completing the onboarding process.
Retention Rates: Percentage of users active on Day 7 and Day 30 post-signup.
Sessions Within the First Week: Average number of sessions per user in their first week, representing initial engagement.
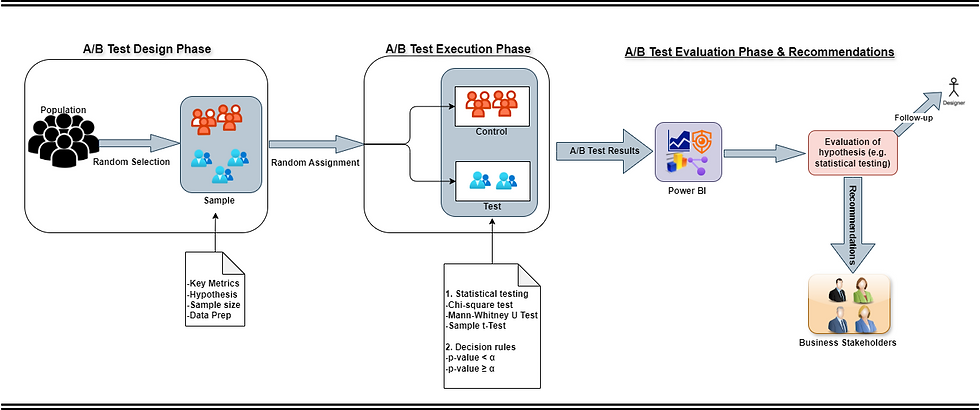
Methodology:
Phase 1: A/B Test Design
Random Sampling:
Users were randomly selected and split into control and test groups to eliminate bias.
Sample Size Calculation:
A statistical formula determined the number of users required to detect meaningful differences between the groups. This ensured adequate power for the test.
Hypothesis Formulation:
3(a). Onboarding Completion Rate:
Null Hypothesis (H₀): No difference exists between the groups for a given metric.
Alternate Hypothesis (H₁): A significant difference exists, favoring the test group.
3(b). Day 7 Retention Rate:
Null Hypothesis (H₀): No difference in Day 7 retention rate between the control group and the test group.
Alternate Hypothesis (H₁): The Day 7 retention rate is different between the control group and the test group.
3(c). Day 30 Retention Rate:
Null Hypothesis (H₀): No difference in in Day 30 retention rate between the control and test groups.
Alternate Hypothesis (H₁): The Day 30 retention rate is different between the control group and the test group.
3(d). Sessions within a week:
Null Hypothesis (H₀): A significant difference in session counts.
Alternate Hypothesis (H₁): No significant difference in session counts.
Data Preparation:
The dataset was cleaned and prepped, ensuring the removal of duplicates and handling of missing values.
Phase 2: A/B Test Execution
Group Assignment:
Users were evenly split into Control (A) and Test (B) groups.
Statistical Testing:
Onboarding Completion Rate and Retention Rates: These binary metrics were analyzed using the Chi-Square Test.
Sessions Within the Week: This count data metric was analyzed using the Mann-Whitney U Test, a non-parametric alternative to the t-test.
Decision Rules:
Based on a p-value threshold (α = 0.05), the results were classified as statistically significant or not.
Phase 3: A/B Test Evaluation
Visualization:
Tools like Power BI, Matplotlib, and Seaborn were used to create intuitive visualizations, aiding in the interpretation of results.
Robustness Checks:
Effect Size Analysis: Quantified the magnitude of differences beyond statistical significance.
Bootstrap Sampling: Repeated resampling of the data provided confidence intervals for key metrics, ensuring the reliability of findings.
Key Insights:
Onboarding Completion Rate:
The completion rates were similar for both groups, suggesting that the new onboarding flow did not significantly outperform the existing one.
Day 7 Retention:
The test group exhibited a noticeable increase in retention, indicating early engagement benefits from the new onboarding design.
Day 30 Retention:
Retention rates were similar across both groups, indicating that the initial engagement boost from the test group did not sustain over time.
Sessions Within the First Week:
Users in the test group completed more sessions, highlighting improved short-term engagement.
Recommendations:
Based on the findings, we proposed several strategies for further optimization:
Personalized Onboarding:
Tailor the onboarding experience for different user segments (e.g., new vs. returning users).
Gamification Elements:
Introduce progress bars, achievements, or rewards to motivate users.
Streamlined Design:
Reduce cognitive load by presenting essential features step-by-step.
Qualitative Feedback:
Gather insights from users who drop off during onboarding to identify pain points.
Iterative Testing:
Design follow-up A/B tests to explore specific hypotheses, such as the effect of gamification or personalized flows.
Time Analysis:
Track time spent on each onboarding step to identify bottlenecks.
Conclusion
The new onboarding flow demonstrated measurable improvements in early user engagement, particularly in Day 7 retention and weekly sessions. However, the lack of sustained impact on Day 30 retention suggests room for further refinement.
By implementing our recommendations, the neo bank, an ecommerce, or an edtech company can enhance the onboarding experience, fostering higher user engagement and retention rates. This approach not only boosts customer satisfaction but also contributes to long-term growth and profitability.


